Remote Debugging Maximo and Manage
May 13, 2025
Introduction
Maximo is an extremely complex enterprise application and fully understanding the nuance of its behavior can be difficult. Remote debugging allows a developer to peer into the inner workings of Maximo and inspect the application state and its process every step of the way. This provides an invaluable tool in understanding Maximo business processes and capabilities. It also can be very helpful for troubleshooting when your code in Maximo is not behaving as expected.
In this blog we will detail how to configure Maximo for remote debugging, how to configure IntelliJ (https://www.jetbrains.com/idea/) to connect to Maximo and how to obtain the necessary libraries to step through the Maximo processes.
Server Configuration
The Java Virtual Machine (JVM) provides the capability to connect a remote debugging client to observe the internal processing of the JVM. This allows a developer to set breakpoints in their code, observe the state of an application and its variables and step through the process execution on a remote server. This is accomplished through the use of the Java Debug Wire Protocol (JDWP) and while a full discussion of JDWP and remote debugging is beyond the scope this post you can read more about it here https://docs.oracle.com/javase/8/docs/technotes/guides/troubleshoot/introclientissues005.html.
Maximo Application Suite Manage
Enabling JDWP requires JVM options be added to the Maximo process. To do this we must update the Maximo Application Suite (MAS) Manage server bundle definition.
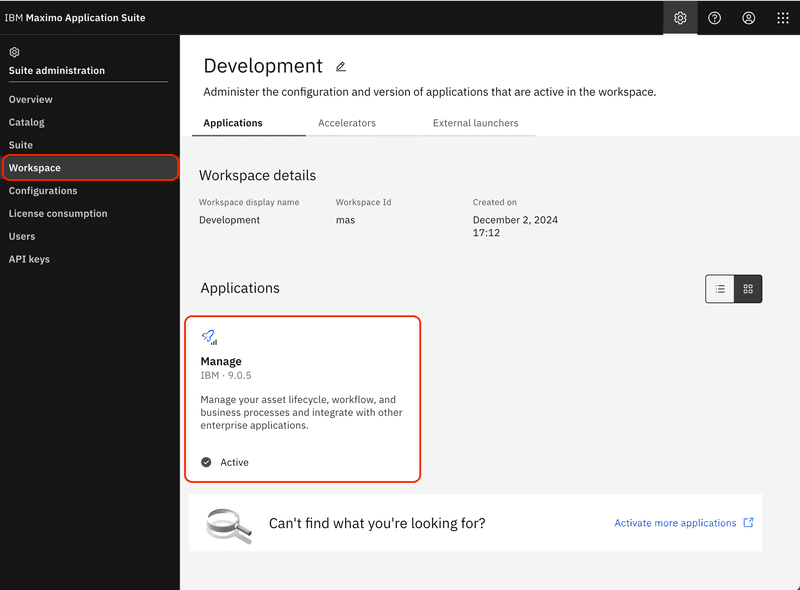
First log in to the Maximo Application Suite and navigate to the Suite administration. From the left side navigation bar, select the Workspace option and then select the Manage tile.
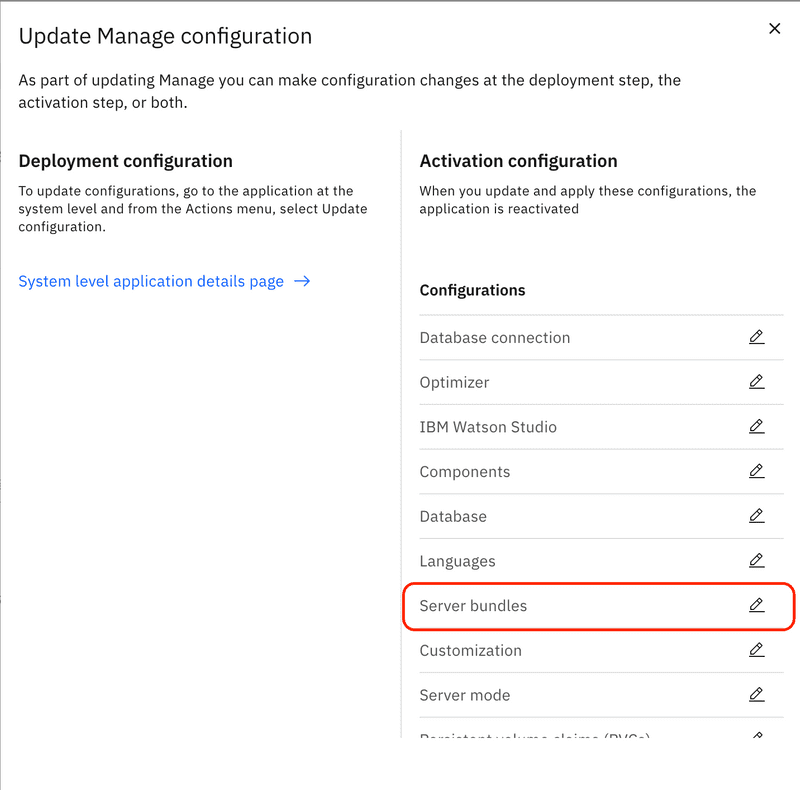
From the Actions menu, select the Update configuration menu option.
Select Server bundles from the Configurations list by clicking the edit pencil icon on the right of the entry.
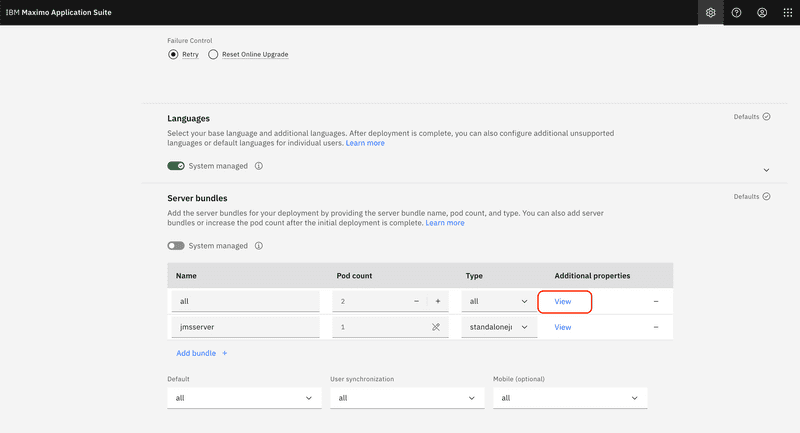
In our example we have two bundles configured and we will update the all bundle, but these steps can be taken for any bundle you want to debug. From the bundle list click the View link under the Additional properties column.
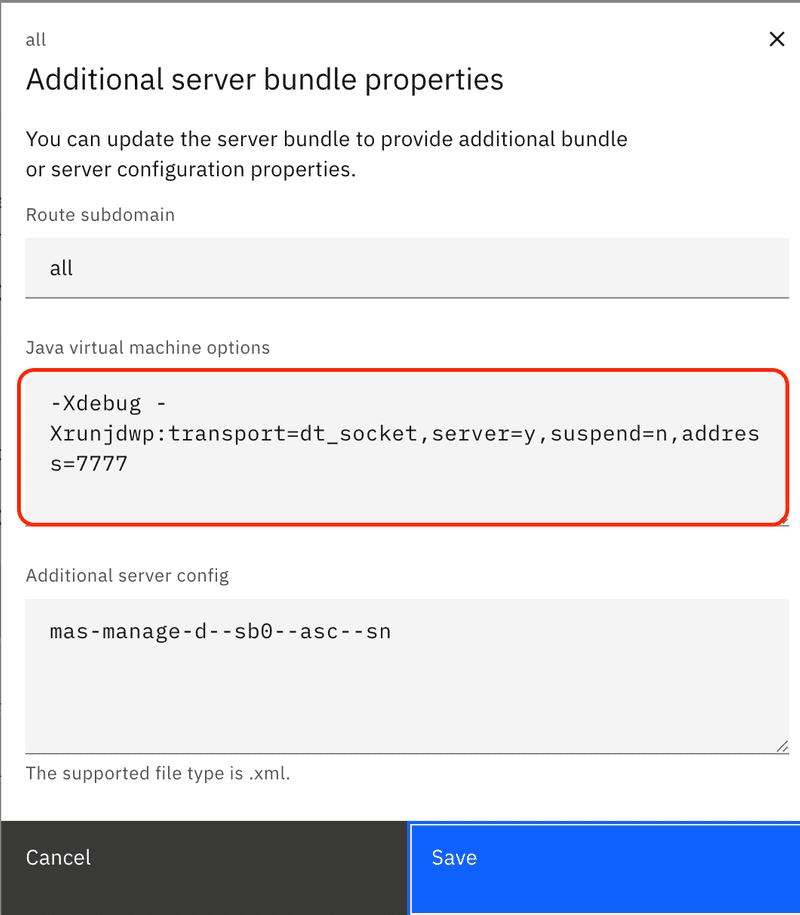
In the Java virtual machine options text box enter the following options. Note that this example uses port 7777 but you may select any available port.
-Xdebug -Xrunjdwp:transport=dt_socket,server=y,suspend=n,address=7777
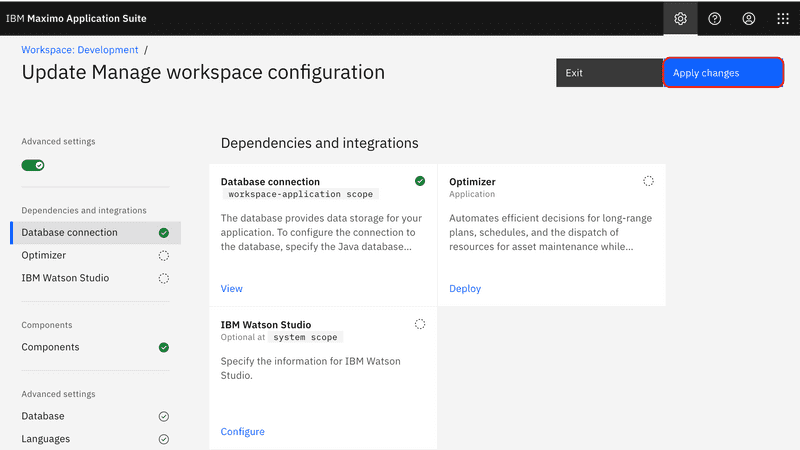
Click the Save button to save the configuration change. Once returned to the Update Manage workspace configuration page, click the Apply changes button to apply the changes.
MAS will generate and deploy a new bundle image and this may take up to two hours to complete.
Maximo 7.6 WebSphere Traditional
If you are still running Maximo 7.6 with WebSphere, the configuration is performed within the WebSphere Integrated Solutions Console and are applied to the individual Server JVMs.
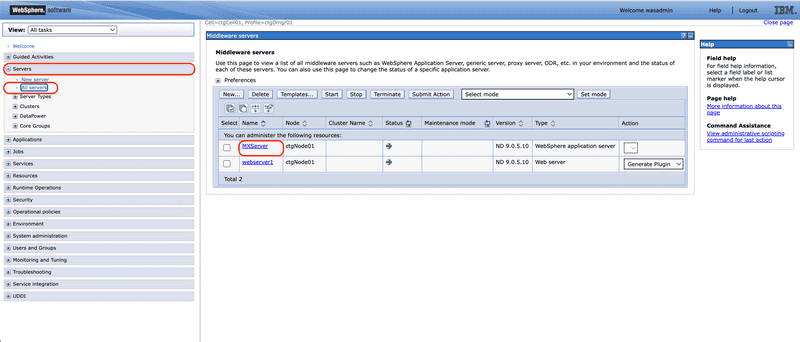
Once logged into the Integrated Solutions Console, expand the Servers menu and select the All servers menu item. Then select the server to enable debugging on. For our example we select the MXServer server.
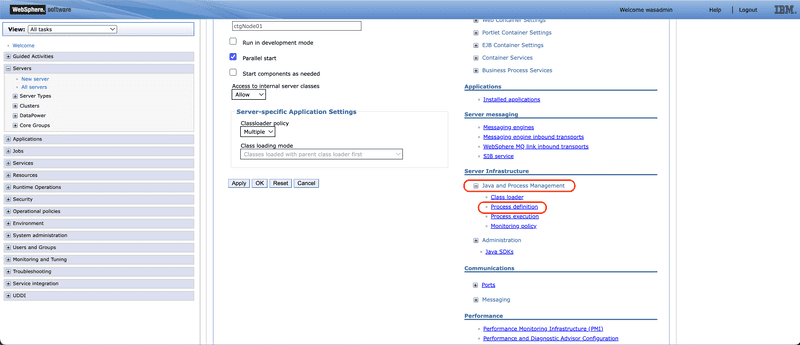
From the Server Infrastructure heading, expand the Java and Process Management menu item, then select the Process definition option.
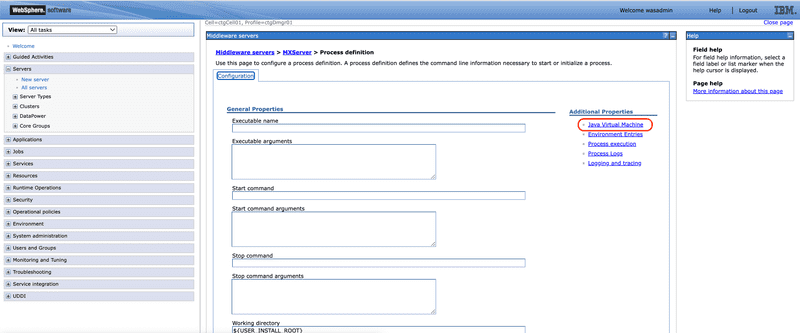
From the Additional Properties heading, select the Java Virtual Machine menu item.
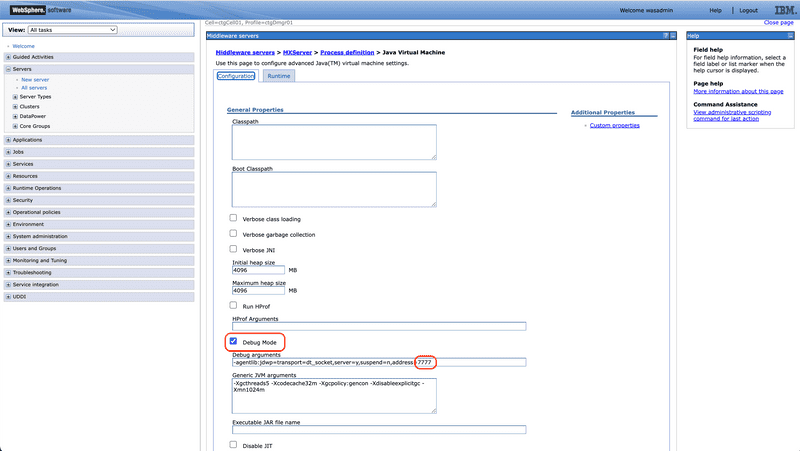
Ensure that the Debug Mode checkbox is checked and then confirm the debug port in the Debug arguments section, adjusting the port number as necessary as each JVM must have a unique port number. Then click the Apply button and apply the changes and then save to the master configuration. The JVM server will need to be restarted for the change to take effect.
The debug port much be unique amongst all the debug enabled JVM processes. The default port is
7777, but any open port is valid.
Pod Port Forwarding
OpenShift does not provide a means to expose non-HTTP communication outside of the cluster and JWDP does not operate over HTTP, so it is not accessible by default outside of the OpenShift cluster. Fortunately the OpenShift Command (oc) interface provides port forwarding to handle non-HTTP communication. You will need access to the OpenShift console and the OpenShift Command Line Interface (CLI) tool for your version of OpenShift.
You can download the CLI from here, being careful to select the version that matches your OpenShift deployment: https://docs.redhat.com/en/documentation/openshift_container_platform/4.11/html/cli_tools/openshift-cli-oc#cli-installing-cli_cli-developer-commands
More details for the OpenShift CLI tool can be found here: https://docs.redhat.com/en/documentation/openshift_container_platform/4.11/html/cli_tools/openshift-cli-oc#cli-getting-started
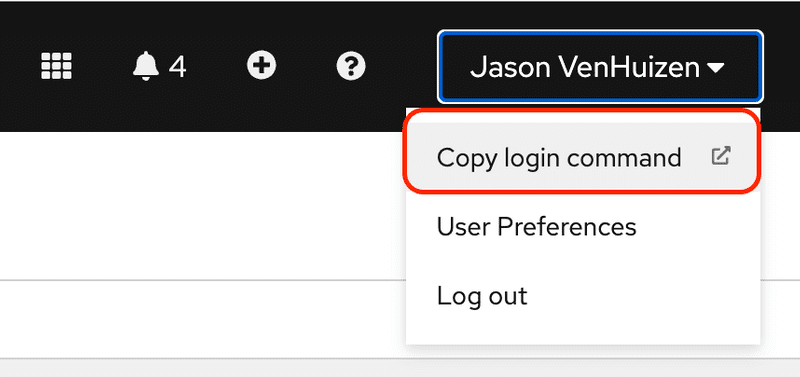
Once you have access to the OpenShift console and have the OpenShift CLI tool installed, log into the OpenShift console. From the top right menu, where your name is displayed, click the menu and select Copy login command.
You may be required to re-authenticate, after which a screen with a Display Token link is displayed. Click the Display Token link to display the token, which will look like the following.
Copy the Log in with this token command, open a terminal / command window and run the command to connect to the OpenShift cluster with the OpenShift CLI tool.
Switch to your MAS Manage project, typically something similar to mas-instance_id_here-manage and in our example mas-dev-manage, by issuing the command oc project your_project_name_here.
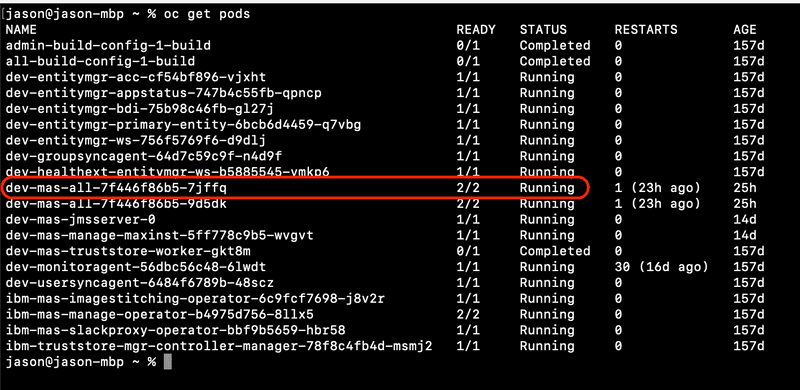
Next identify the pod you want to debug and expose through port forwarding. This works best in a single pod deployment in development so you know that your UI session is connected to the pod you are debugging. To get a list of available pods run the command oc get pods. In the example below the pod dev-mas-all-7f446f86b5-7jffq is the all server bundle pod running Manage.
Finally, run the port forwarding command oc port-forwarding <pod_name_here> 7777:7777 to forward port 7777 locally to port 7777 on the remote pod. Note that the port number here matches the port number specified in when you added the JVM debug properties and may be different from the standard 7777 port.
If successful, the following message should be displayed.
IntelliJ
JetBrains' IntelliJ is an excellent Java Integrated Development Environment (IDE) available, offering excellent tools, integration and development work flows. It also will pull source code from Maven where available and has an excellent Java de-compiler built in, so exploring 3rd party libraries is a seamless experience.
Note that depending on your jurisdiction and local laws, de-compiling commercial software may be illegal, but even in cases where it is allowed, it may violate the End User License Agreement. For example the IBM base license agreement, section 1, part e, subpart 3, states that the license is subject to the Licensee
not reverse assembling, reverse compiling, translating, or reverse engineering the Program, except as expressly permitted by law without the possibility of contractual waiver.The full agreement can be found here: https://www.ibm.com/support/customer/csol/terms/?id=i125-3301_FED&cc=us&lc=en
Create Debug Project
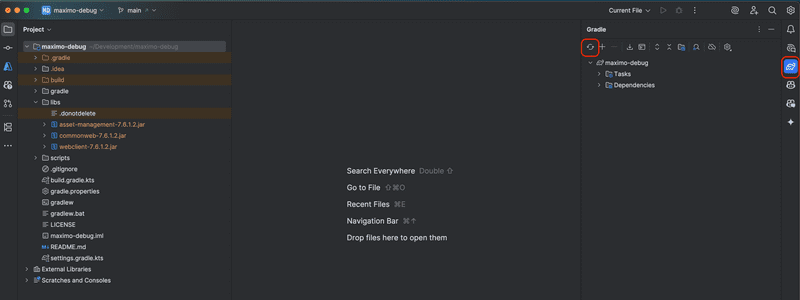
Sharptree provides a simple IntelliJ project for debugging Maximo on GitHub, here: https://github.com/sharptree/maximo-debug. Clone the project from GitHub (https://github.com/sharptree/maximo-debug.git) and then open the build.gradle.kts file to import the project. Using the extract.library.js automation script found in the scripts directory, extract the Maximo libraries from your target system. Unzip the extracted libraries to the libs directory and reimport the libraries as shown below.
Configure Remote Debugging
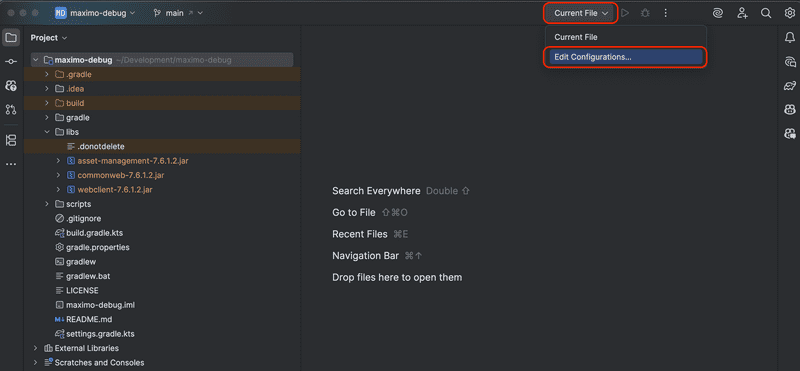
From the Configurations menu on the top right of the application, select the drop-down arrow next to Current File and select Edit Configurations....
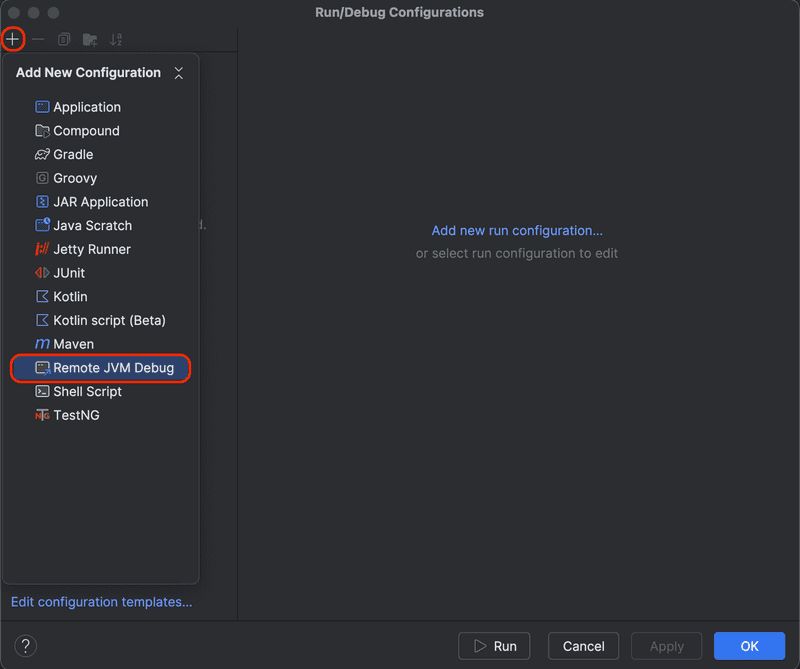
Click the plus button on the top of the Configurations list and then select the Remote JVM Debug option.
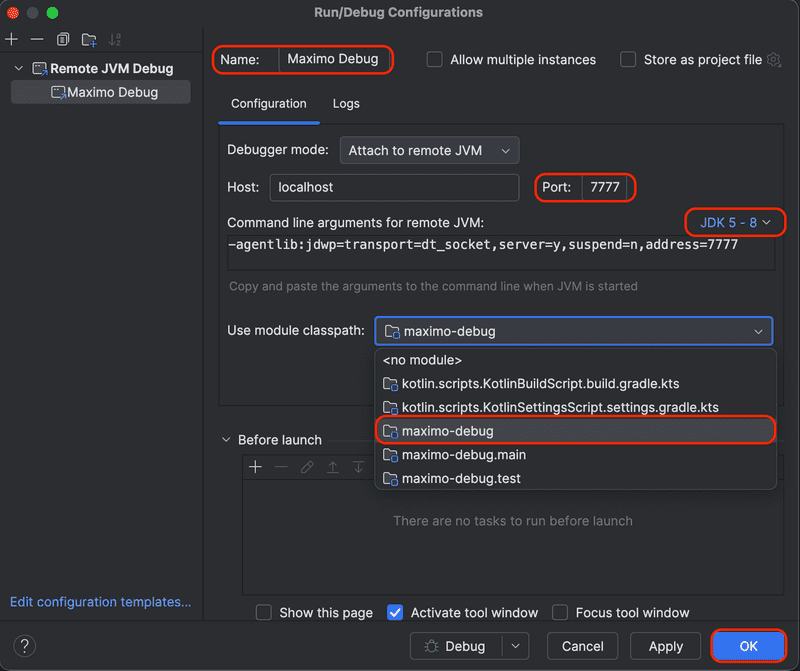
A dialog for the remote debug configuration will be displayed, enter Maximo Debug for the Name, if using the OpenShift CLI port-forward option, use localhost for the Host field otherwise use the server name for the WebSphere server, the Port field should be set the port number configured earlier, by default 7777, then select JDK 5 - 8 for the JDK type and finally select the project name for the Use module classpath, in the example below it is maximo-debug. Once complete click the OK button to save the configuration.
Connect and Debug
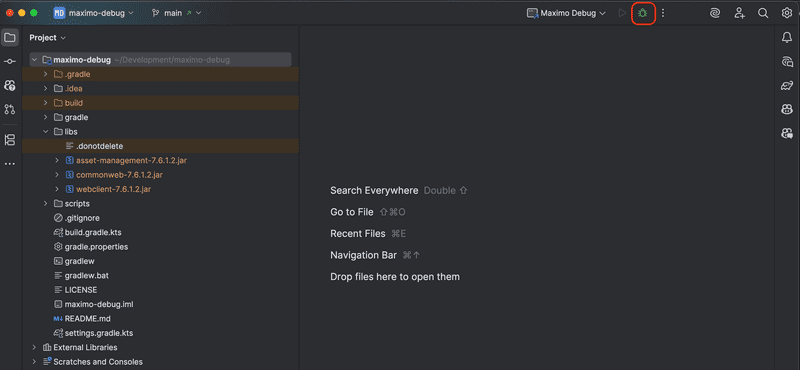
Now that remote debugging has been configured on the server and IntelliJ we can connect our remote debugging process. To start remote debugging, select the debug configuration from the drop down menu, in this example Maximo Debug and then click the debug icon.
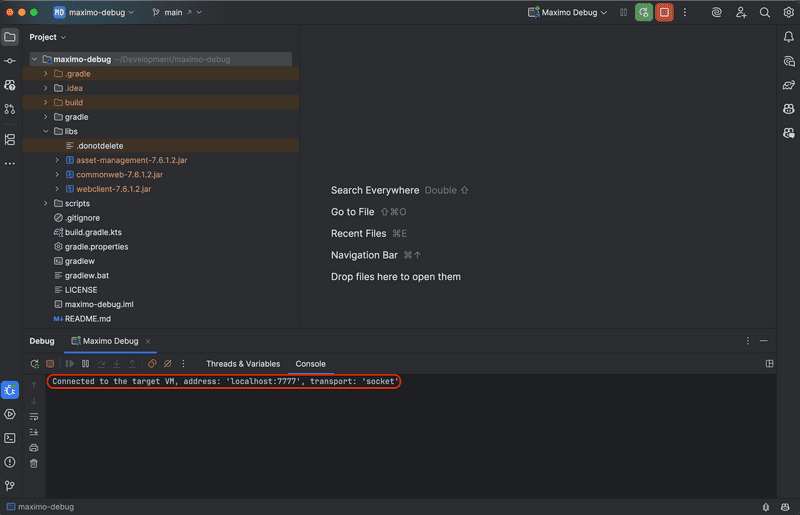
Once connected the debug panel will be displayed at the bottom of the screen and a message is displayed confirming that the process has connected to the remote server.
You may set breakpoints in your code, or code that you have access to such as open source libraries, and step through the remote execution. You may also inspect and even modified the current state of the remote JVM, allowing you to gain valuable insight into how your code is executing within Maximo.
Final Thoughts
In this post, we explored how to configure Manage and legacy Maximo to enable remote process debugging of the JVM. We then stepped through the process of configuring the IntelliJ IDE with the necessary Maximo libraries and configurations to connect to the remote JVM for debugging. This allows the developer to see in real time what a remote process is doing and gain insight into the application operation.
If you have any questions, comments or have suggestions for topics you would like to see us cover, please reach out to us at [email protected]
